Electrostatic Precipitator(ESP)
Airflow Sciences Corporation has been a leader in electrostatic precipitators (ESPs) flow modeling and field testing since 1985. Proper flow through an ESP is critical to optimal performance. Improper flow can result in high opacity, spiking during rapping or load changes, unwanted ash buildup, erosion, and increased particulate emissions.
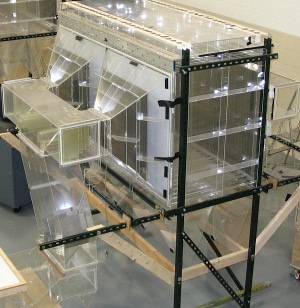
ASC has conducted over 300 flow studies involving ESP's, helping dozens of clients to alleviate various concerns.
Airflow Sciences has also been an invited speaker to over 20 industry conferences on the topic of ESP flow optimization. Presentation materials can be found in the resources section.
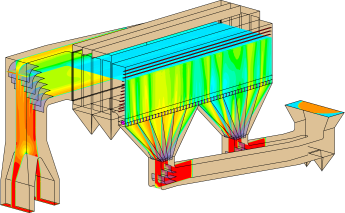
An example of flow streamlines through an ESP using the Azore CFD software package can be seen here.
Learn more :
- Optimizing Electrostatic Precipitator Design and Performance
- ESP Performance Optimization on Youtube